Over the years we have had some fun taking viewers around the world in our Sea Level Check series. Now you too can get in on the action by going to the NOAA Tides and Currents website where the data are archived.
If you do, you will see this map:
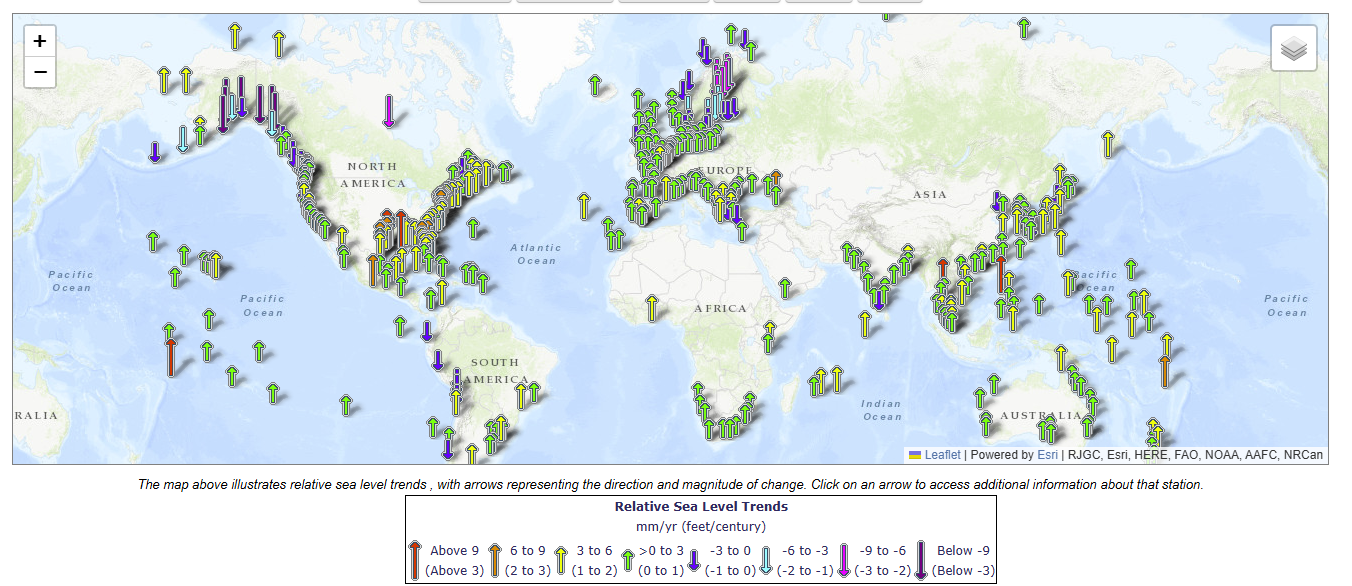
The arrows indicate the local Relative Sea Level (RSL) trend which takes account of both changing ocean heights and changing land heights, so it measures what people at that location will actually experience. You’ll notice that many places show an upward trend but many show the opposite, sometimes within close proximity to each other.
If you click on a particular arrow on the map, a box then comes up telling you where the tide gauge is located. And if, say, we click on Brest, France then in the box click Linear Trend, a new page pops up where we see this data and calculated trend line:
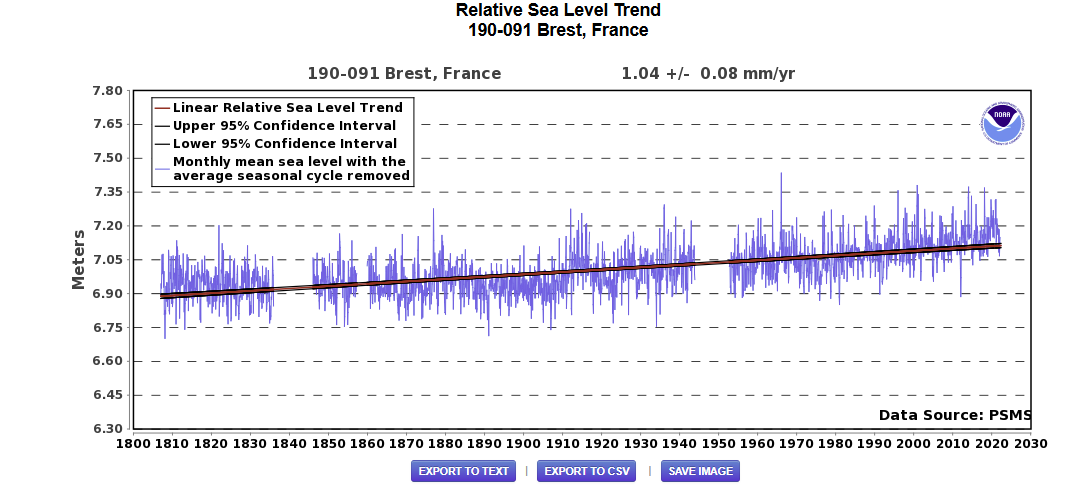
In that particular spot RSL rise for the last two centuries and a bit more has averaged just over 1 mm per year, or 10 centimeters (about 4 inches) per century.
So if you live in Brest, or in any other seaside location, and you want to find out whether you need to panic about rising sea levels, you know where to #Lookitup.


How much does wind and wind direction affect sea levels?
I live in Beaufort, SC, USA, just south of Charleston SC. I am an avid fly fisherman and target red drum when they enter the tidal marshes when there is enough tide to flood the tidal marsh. I hold clinics on the topic and am currently writing a book on the subject.
Winds speed and direction can raise and lower tide levels by as much as foot. A tidal marsh that may have knee deep water today with a slight East wind may only have ankle deep water the next day, ~25 hours later, with a brisk Westerly.
Has anyone done an overlay of wind direction and speed over the variables seen in the mean high tides of these tide gauges?
The rate of sea level rise has not changed in centuries anywhere.But for many millenia after the last major ice age ended the rate of sea level rise was much much higher than today.Eventually,the rate greatly leveled off to what we see today.Nothing to do with human activity.